Power BI · Data Analysis Case Study

Viral Social-Media Engagement Analysis

An interactive Power BI report analysing 5,000 viral social-media posts across four platforms, eight regions, six content formats and ten hashtags — turning raw engagement data into clear, decision-ready insights.

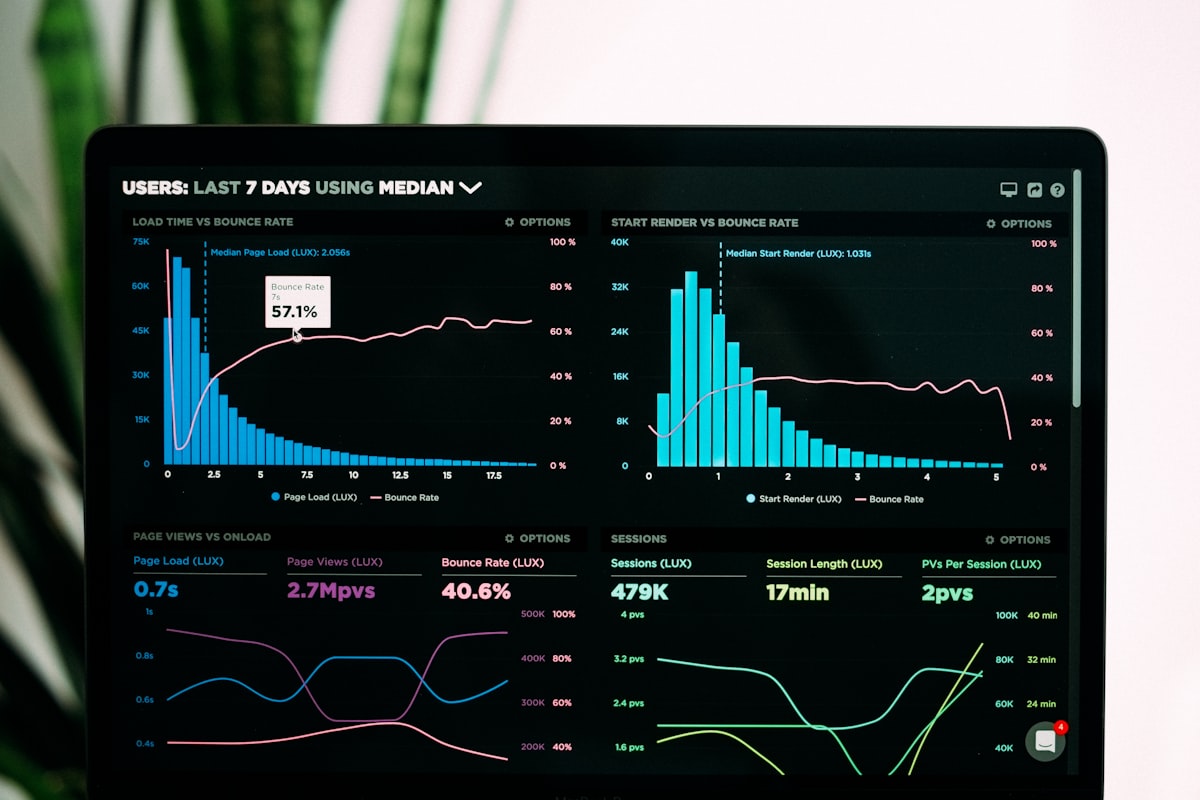
Presenting analytics
4Platforms
8Regions
6Formats
10Hashtags
5,000Posts

Key Metrics

The headline numbers

The total engagement the dataset represents, aggregated across all 5,000 posts.

Total Views
12.47B

Total views across every platform and region.

Total Likes
1.26B

The largest engagement signal — about three-quarters of all interaction.

Total Shares
252.6M

How often content was passed on to new audiences.

Total Comments
124.4M

Direct conversation generated by the content.

Engagement Rate
13.1%

Likes, shares and comments combined, as a share of views.

Posts Analysed
5,000

Individual posts, each with platform, region, format and hashtag.

Building the report
About the dashboard

What the report shows

The dashboard rolls a single post-level dataset up into the views that matter to a brand — by platform, region, content format and hashtag — reporting true engagement totals alongside average performance per post, so volume and quality can be read separately.

  • Four core signals: views, likes, shares and comments
  • An overall engagement rate, plus per-post averages
  • Reach distribution across global markets
  • A clean, three-page report built for a top-down read

How engagement is composed

share of interaction
Likes 76.9% Shares 15.5% Comments 7.6%
Key Insights

What the data tells us

The most important, decision-relevant takeaways — explained plainly.

1

Reach is driven by volume, not virality

Average views per post stay flat — around 2.5 million — across every platform, format and hashtag. Total reach is mostly a function of how much a channel posts.

2

Instagram earns the strongest engagement

At a 13.8% engagement rate, Instagram turns views into likes, shares and comments more efficiently than any other platform.

3

The USA is the largest audience

The United States accounts for 14.1% of all views — the biggest single market — followed by Brazil, the UK and Canada.

4

The "engagement level" label is misleading

Posts tagged "High" average slightly fewer views than those tagged "Low", so the label shouldn't be used to prioritise content.

5

Content format barely changes reach

Reels, Tweets, Videos, Shorts, Live Streams and Posts all land within a couple of percent of each other on average views.

6

Likes dominate the engagement mix

On every platform, likes make up roughly three-quarters of total engagement, with shares and comments making up the rest.

Inside the report

Three pages, one story

The dashboard is organised as a top-down narrative across three pages — built in Power BI, designed to be read by a decision-maker.

Page 1

The Numbers

Headline totals, total views by platform and region, and the engagement-level split.

Page 2

Per-Post Performance

Average views and likes per post, the platform-by-format breakdown, and the engagement mix.

Page 3

Audience & Findings

Each region's share of views, top hashtags by reach, and a short analyst's note.

Analytics dashboard

The dataset

Viral_Social_Media_Trends.csv — 5,000 individual posts, each described by platform, hashtag, content format, region, engagement level, and four engagement metrics (views, likes, shares and comments). Every figure on this page is computed directly from this file.

Built with

Tools & skills

Microsoft Power BI Data Modeling KPIs & Aggregation Data Storytelling Business Intelligence Statistical Analysis

Explore the full dashboard

Download the Power BI file and open it in Power BI Desktop to interact with every chart.

Explore